








Over the past two decades, Canada’s real estate market has been shaped by one dominant force: interest rates.
While supply, demand, and immigration all play major roles, nothing influences affordability, and ultimately home prices, more directly than the cost of borrowing.
To understand where the market is heading, we need to look at where it’s been.
Mortgage vs Overnight Rates
When people talk about “interest rates,” they’re often referring to the benchmark rate set by the Bank of Canada—also known as the overnight rate. This is the rate banks use to lend to each other, and it forms the foundation of the entire lending system.
But the mortgage rates are just as important to follow because they indicate what homebuyers actually pay.
While they’re heavily influenced by the Bank of Canada’s decisions, they aren’t identical. Lenders also factor in things like bond market trends, risk, and their own margins.
In simple terms:
The overnight rate sets the direction
Mortgage rates determine affordability
When rates fall, borrowing becomes cheaper → buyers can afford more → prices rise
When rates rise, borrowing becomes expensive → buyers qualify for less → prices soften
A 20-Year Snapshot: How Much Have Rates Really Changed?
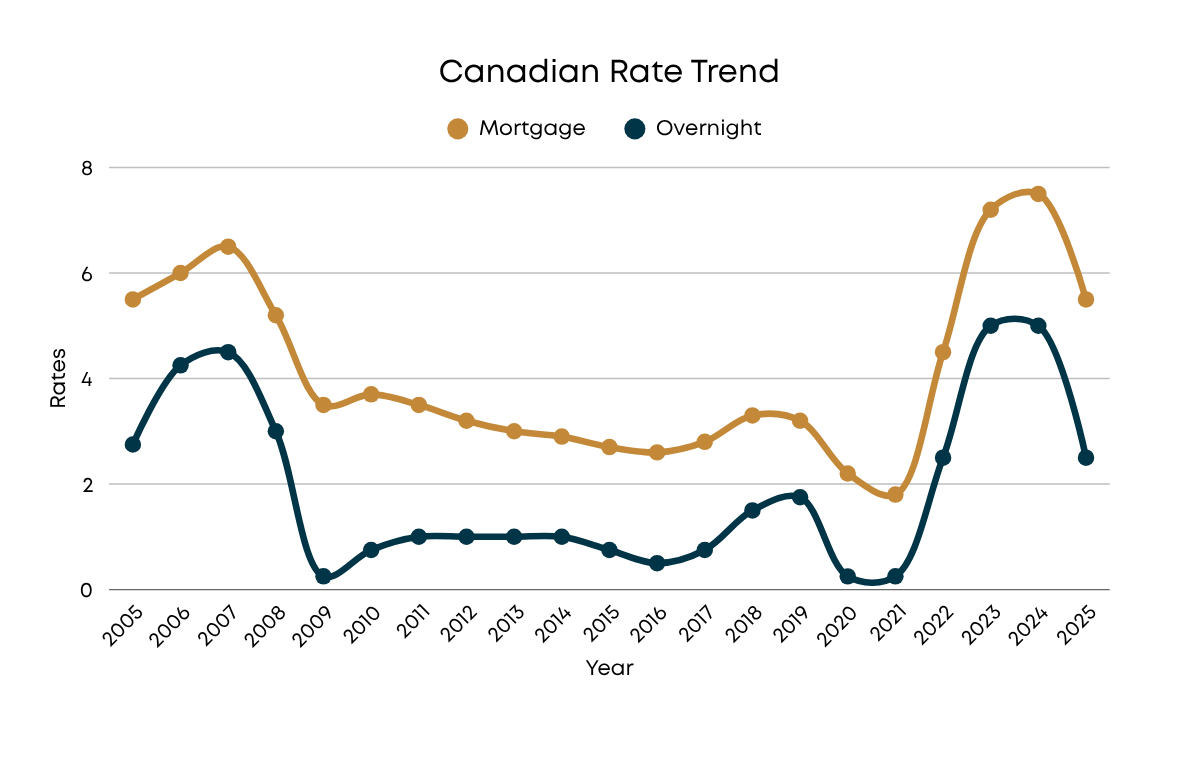
A line graph depicting the movement of overnight and mortgage rates in Canada over the past 20 years
First, here’s a look at the important milestone in the rates over the years:
2005–2007: ~5–7% mortgage rates
2008–2009 (Financial Crisis): Sharp drop to ~3–5%
2010–2019: Historically low, hovering ~2.5–4%
2020–2021 (COVID era): Record lows near ~1–2%
2022–2024: Rapid spike to ~6–8%
2025: Beginning of gradual easing (~5–6%)
This timeline shows a massive structural shift. For example, variable mortgage rates fell from over 7% in 2007 to under 3% by 2021, before climbing back above 7% by 2023–2024.
At the policy level, the Bank of Canada’s benchmark rate dropped to near-zero during COVID and then surged to around 5% in 2024 before being cut back toward ~2.25% in 2025.
The Big Picture Behind Those Rates
Pre-2008 Stability
Rates were moderate and predictable. The market grew steadily, supported by strong economic conditions.
Post-2008 Stimulus Era
After the global financial crisis, rates dropped significantly to stimulate the economy. This marked the beginning of a long period of cheap borrowing.
The Ultra-Low Rate Boom (2015–2021)
This period fundamentally reshaped the housing market:
Record-low rates increased demand dramatically
Home prices surged (in some markets over 50% during COVID)
Buyers became accustomed to cheap debt
The Rate Shock (2022–2024)
One of the fastest rate hiking cycles in Canadian history:
Rates jumped from near 0% to ~5%
Mortgage payments surged
Buyer demand dropped sharply
Delinquencies and financial stress began rising
The Transition Phase (2025–Present)
Rates are now declining again, but the market remains cautious:
Buyers are waiting for further rate cuts
Prices are stabilizing or slightly declining in some regions
Affordability is improving—but still strained
A Real-World Impact
A 1–2% change in mortgage rates can reduce a buyer’s purchasing power by 10–20% or more. That’s often the difference between entering the market or being priced out entirely.
This is exactly what happened during the 2022–2023 rate hikes, when affordability hit its worst levels since the early 1990s.
Why Understanding The History Matters Today
It Provides Context (Rates Today Aren’t “High” Historically)
It Explains Market Psychology
It Helps Predict Market Direction
Many buyers today are anchored to ultra-low pandemic rates, which creates hesitation. But rates are actually closer to long-term norms.
Agents understand that rates tend to move in cycles, not straight lines.
based on the history, we’re over the hump of our current peak.
What This Means for the Future of the Market
Based on historical patterns, we’re likely entering the early stages of the next market cycle.
If rates continue to ease:
Short term: Increased buyer activity
Medium term: Price stabilization
Long term: Upward pressure on home values
However, this cycle may look different due to:
Higher household debt levels
Ongoing supply shortages
Stricter lending conditions
The Bottom Line
Interest rates are the backbone of the real estate market.
Over the past 20 years, we’ve seen:
A shift from moderate → ultra-low → rapidly rising → stabilizing rates
A direct correlation between rate changes and housing demand
Clear cyclical patterns that repeat over time
Understanding these trends isn’t just useful—it’s essential.
Because while no one can predict the future perfectly, history gives us a powerful lens to interpret what’s coming next.